Charts that belong in your product.
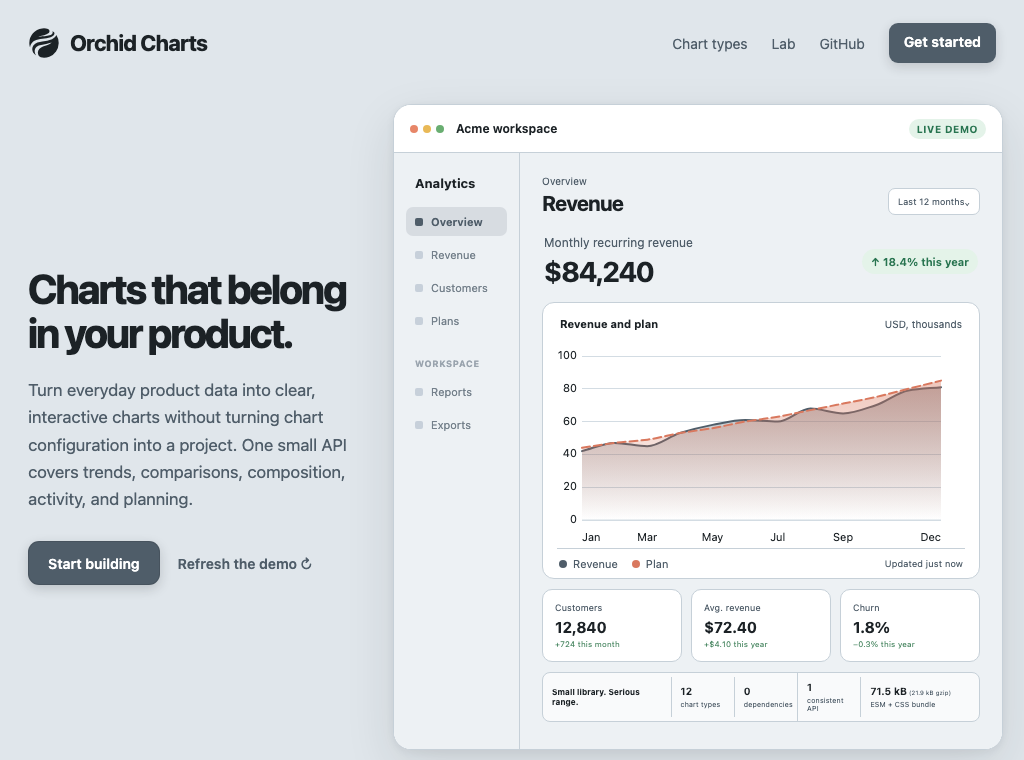
Orchid Charts turns everyday product data into clear, responsive SVG charts. One small JavaScript API covers dashboards, reports, activity views, and release plans—without turning chart configuration into a project.
npm install @orchidsoftware/chartsAdd an element for the chart:
<div id="revenue"></div>Then choose a chart, add your data, and render it:
import { LineChart } from "@orchidsoftware/charts";
import "@orchidsoftware/charts/style.css";

const revenue = LineChart.make("#revenue")
  .labels(["Jan", "Feb", "Mar", "Apr"])
  .dataset("Revenue", [42, 48, 57, 63])
  .colors(["#2563eb"])
  .height(300)
  .gradient()
  .render();
The result is responsive and already includes axes, labels, a tooltip, keyboard navigation, and accessible SVG text.
- One fluent language. Every chart starts with
make(), accepts domain data, and returns the same update, selection, export, and cleanup lifecycle. - Twelve focused chart types. Trends, comparisons, composition, activity, and planning use named definitions instead of a generic configuration maze.
- Made for interfaces. Responsive SVG, tooltips, keyboard navigation, reduced motion, and dark product surfaces work together.
- Small and typed. Orchid Charts has zero runtime dependencies, tree-shakeable ESM, explicit CSS, source maps, and TypeScript declarations.
Chart-wide methods keep common changes close to the data:
import { BarChart } from "@orchidsoftware/charts";

const orders = BarChart.make("#orders")
  .title("Orders by status")
  .labels(["Web", "Retail", "Partners"])
  .dataset("Shipped", [124, 86, 43])
  .dataset("Processing", [32, 18, 12])
  .colors(["#2563eb", "#f59e0b"])
  .horizontal()
  .stacked()
  .height(280)
  .render();
Use the same vocabulary across all twelve chart types:
Choose a chart → make(parent) → add data → shape it → render()
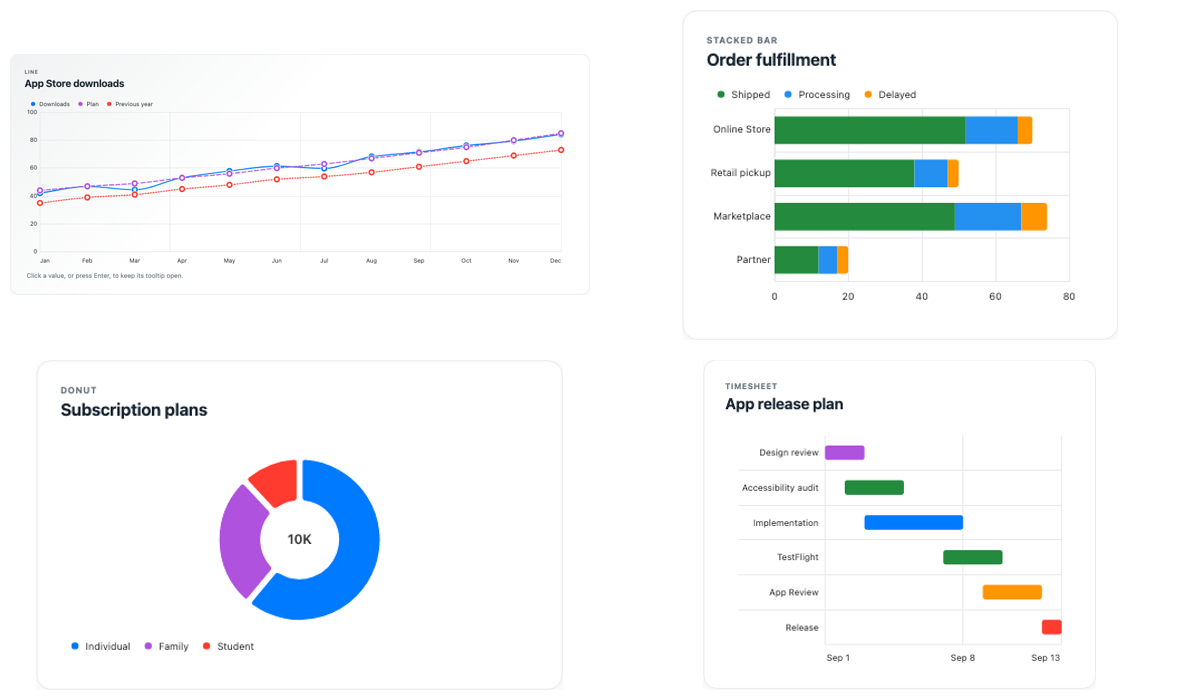
| If you want to show… | Start with… |
|---|---|
| Change over time | LineChart |
| Comparisons between categories | BarChart |
| A line and bars on one scale | MixedChart |
| Relationships between values | ScatterChart or BubbleChart |
| Parts of a whole | PieChart, DonutChart, or PercentageChart |
| A profile across several measures | RadarChart or PolarAreaChart |
| Activity by day | HeatmapChart |
| Work across a timeline | TimesheetChart |
See Chart types for a dedicated guide to every chart.
Keep the value returned by render() and replace its data when your product
state changes:
revenue.update({
  labels: ["Jan", "Feb", "Mar", "Apr"],
  datasets: [{ name: "Revenue", values: [45, 52, 61, 70] }],
});
The same chart can also respond to selection, export its SVG, and clean up when its view is removed.
- Getting started — install Orchid Charts and render your first chart.
- Chart types — choose the chart that answers your question.
- Customization — change color, layout, labels, and presentation.
- Updates and interaction — connect charts to live product state.
- Exporting SVG — serialize or download the current chart.
- React, Vue, and Hotwire — mount, update, and clean up charts in components.
- API reference — scan the complete public vocabulary.
Orchid Charts has zero runtime dependencies, includes TypeScript declarations, and targets current evergreen browsers. It is part of Orchid Software, maintained by @tabuna, and released under the MIT License.